

Welcome to the current issue of a quarterly blog featuring Whitman County Trends! The site was launched to inform the residents about many aspects of life of Whitman County, via data. The Trends is generously supported by the Port of Whitman. We hope you enjoy the blog which may take you to the website. As always, EWU and Port appreciate feedback.
Recent Updates
In AGRICULTURE: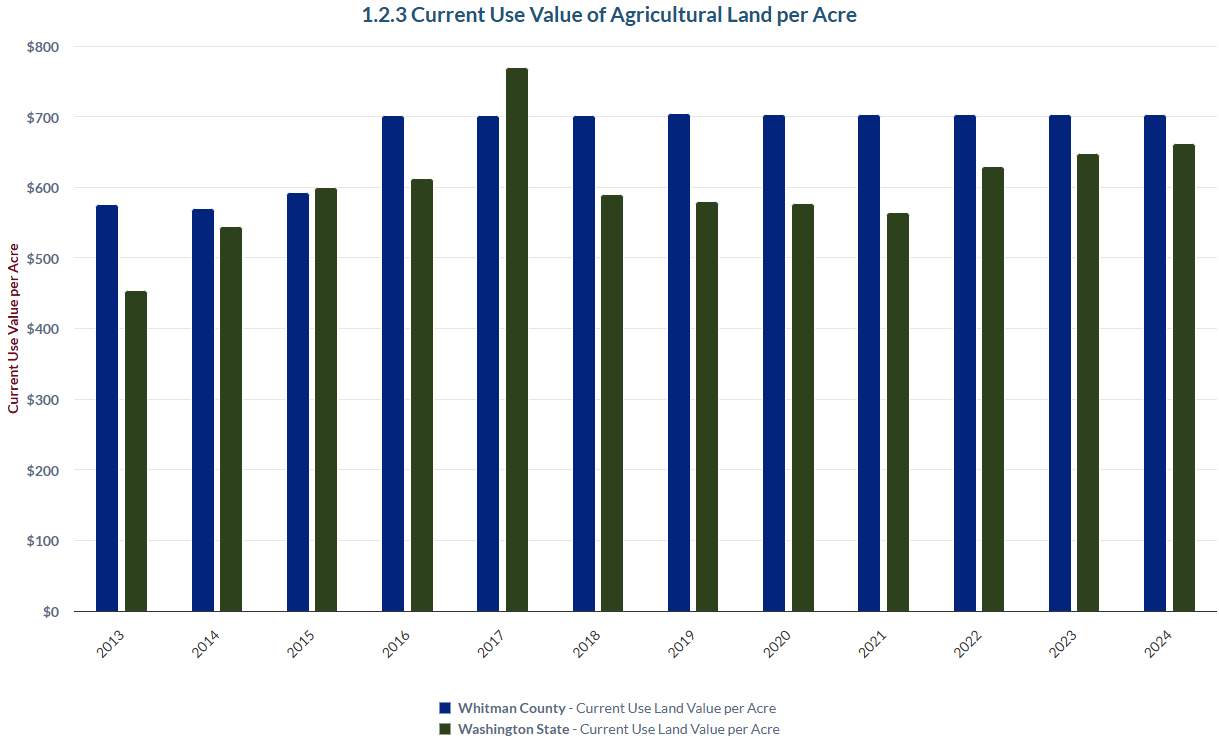
Current use value of agricultural land has not changed for years.
By Washington State law, county assessors may value certain agricultural, timber, and open space lands at a use rather than market value for property tax purposes. Usually, use value is considerably lower than market value.
During 2024, use value for Whitman County agricultural land averaged $703 per acre. This average has been the same since 2016. Washington state average use value of agricultural land was $661 per acre in the same year. The state average has shown much more variability than the county average, peaking in 2017 at $769 before sliding to $565/acre in 2021, then rebounding to its current level.
In ECONOMIC VITALITY: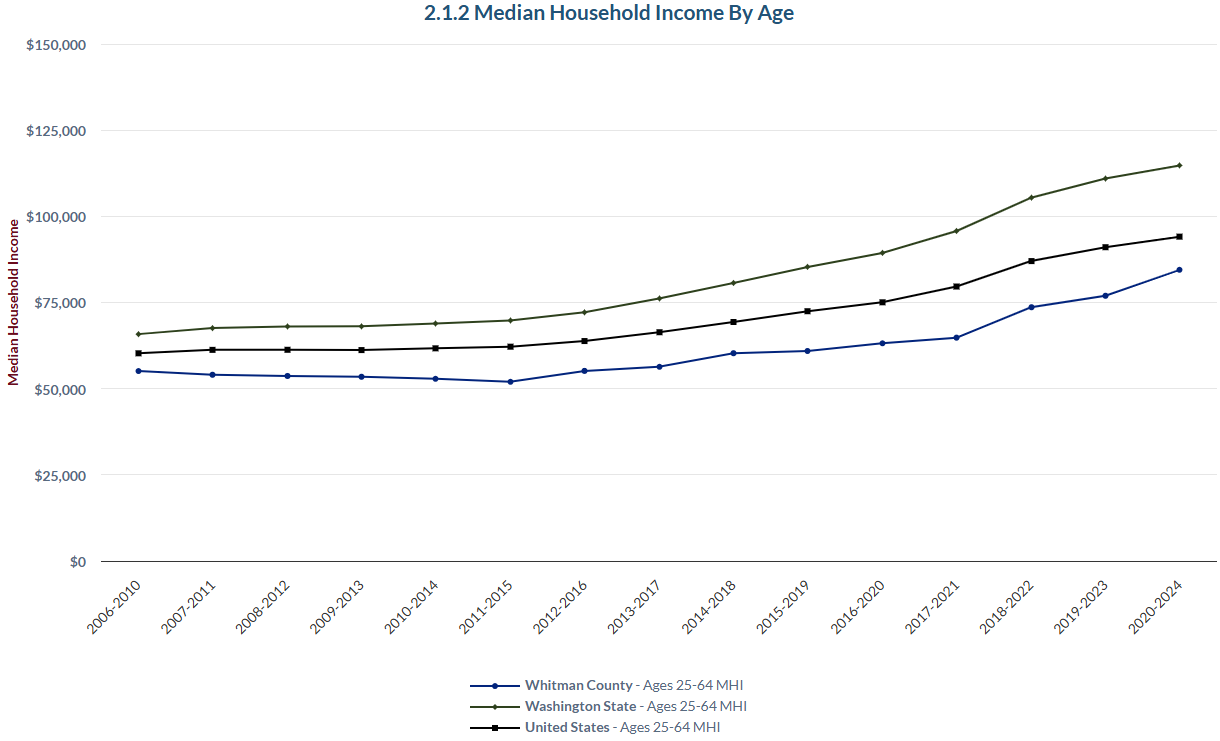
Median household income (MHI) is, in the eyes of most economists, the best representation of the “middle” of a distribution of income. It also carries the advantage of reflecting how most Americans manage their finances, jointly in families or non-family households. However, students living together off campus constitute households and using student incomes can be a misleading when comparing a “college” county to broader averages or medians.
Consequently, this indicator offers a subset of values from the overall income tracked in its companion indicator. Specifically, this indicator measures MHI for those households whose head falls in the age range of 25-64. This excludes the young (including most university students) and the old.
The difference between the values of the companion indicator and the one presented here are large. While both show Whitman County’s MHI to be below those of the U.S. and state, the gap is much smaller in this measure. Over the 2020-2024 period, Whitman County’s MHI for this age group was about $84,400; implying a share of the U.S. at 90%. Compare to the all-age version of median household income in the same period: the county estimate was about $55,400, implying a share of the U.S. of only 69%. 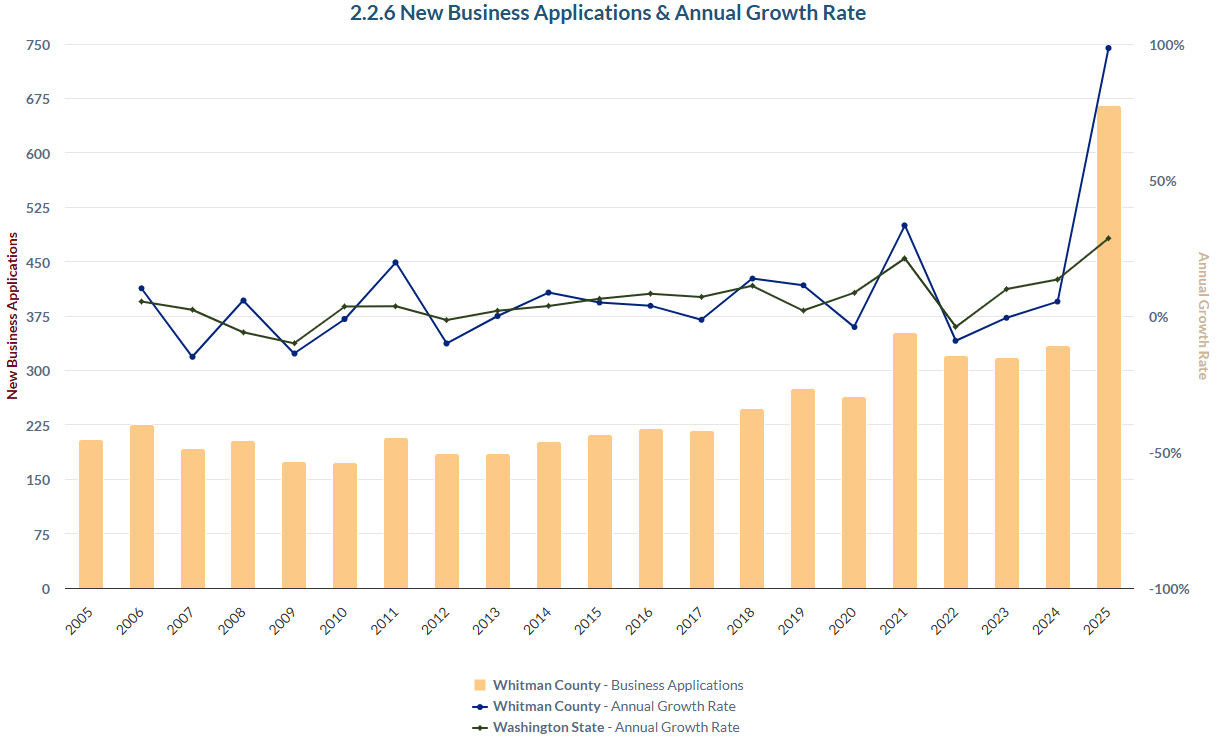
New business applications are now much higher than before the pandemic.
Dynamic, local economies depend on “new blood,” that is, new firms, to provide diversification and additional job opportunities to residents. Equivalently, local economies prize entrepreneurs, those willing to take risks to provide a new product or service.
This indicator measures the steps before the formation of a new business, an application. The applications don’t automatically convert into a business; in fact, only a minority of the applications convert nationally into businesses with employees. (Many more stay as single proprietorships.) Still, getting a sense of the numbers involved in new business applications gives strong hints at the number of new businesses, with or without employees, that will enrich local economy.
In 2024, over 330 applications were turned in for new businesses. This is the second-highest result on record and marks a continuation of the jump in applications following the outbreak of the pandemic. Yet, the recent growth rate in the county is below growth of applications statewide over the past few years.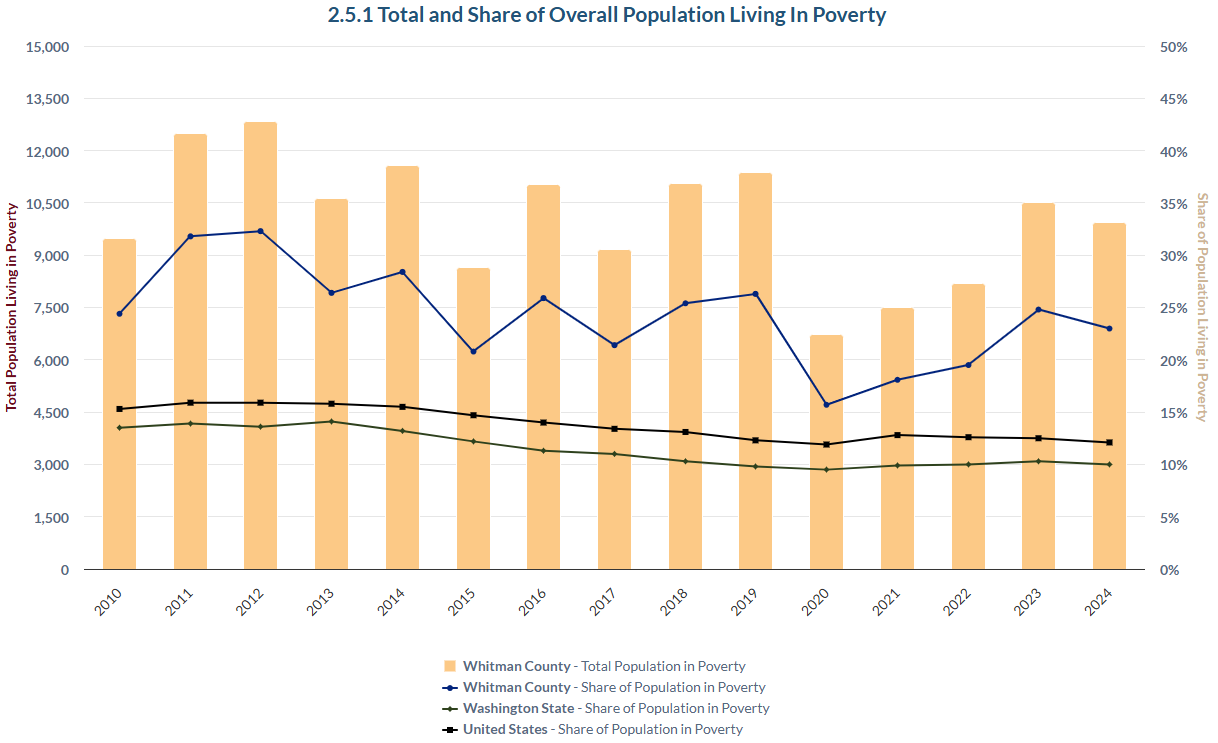
Residential building permits have crashed in the county the past two years.
Residential building is often a cornerstone of a local economy. At least for growing communities. To build, one must secure permits in advance. As such, the number of permits gives an idea of the pace of new construction, whether 1 to 12 months from now.
This indicator tracks the annual count of permits for housing units and disaggregates them by single- versus multi-family. (An apartment complex will have several units, at a minimum.) To enable comparison, the measure also puts the permit number on a per capita basis.
As one can readily see, the past two years have shown the county to have a very weak residential building pulse, with 49 and 33 total permitted units in 2024 and 2025, respectively. Contrast to the recent peak in 2021, where 420 units were permitted. Then and in immediately following years, most of the units were in apartment complexes. This has reversed the past two years, as the few units built are single-family residences. Compared to the U.S. and the state, the “intensity” of residential building permits in the county is now very low. A case of the market resetting after overbuilding?
To simplify the graph, click on those elements in the legend you would like to hide.
In ECONOMIC VITALITY cont: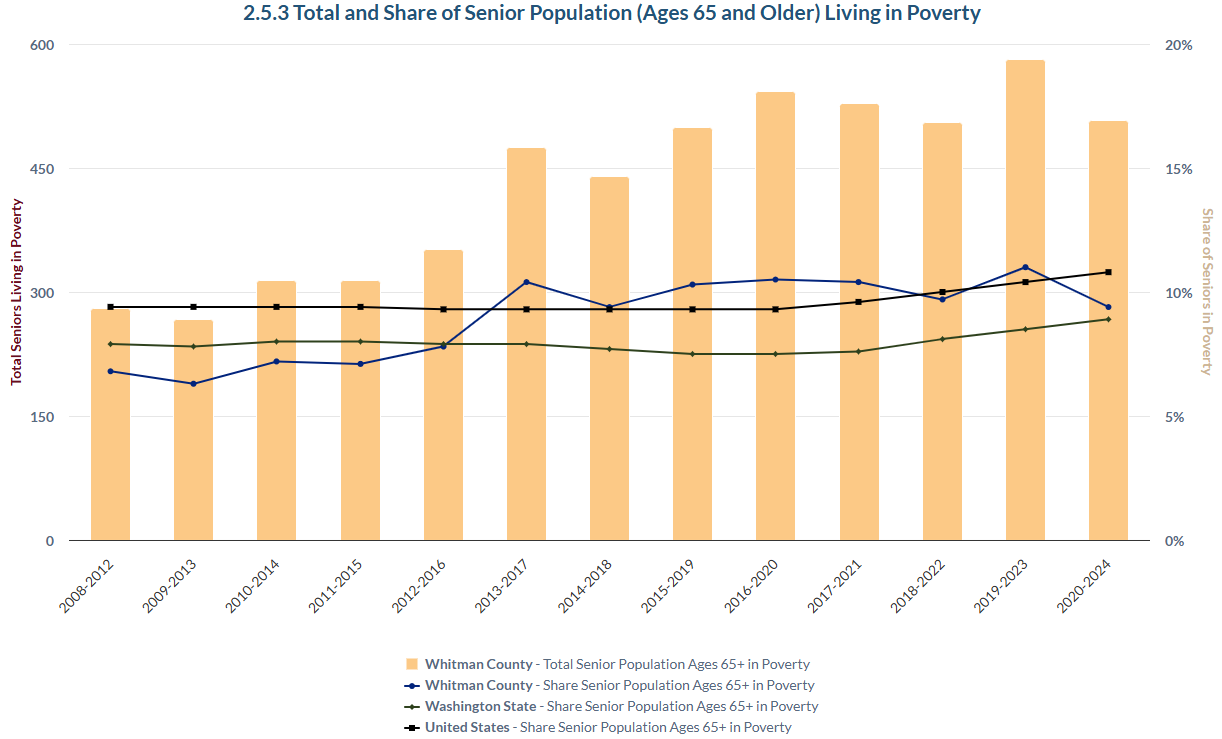
After a pandemic jump, rates for Whitman County older adults living in poverty are receding a bit.
The poverty rate is based on thresholds established by the U.S. Census. The thresholds vary by family size and increase every year by the growth in the Consumer Price Index. (They do not vary by geography.) For example, for a family of two adults and two children (< 18 years), the poverty threshold in 2024 was $31,812, and $30,000 in 2023. If a family’s income was slightly above these numbers, it was not considered to be officially “in poverty.”
The Census tracks poverty rates of various groups of the population, including children and older adults. This indicator takes up the latter group for Whitman County, although the Trends contain measures on child and all-age poverty rates. For the 65+ population of the county in the 2020-2024 interval, 507 people were estimated to live in poverty. While the fourth highest total on record, the poverty rate for this period, at 9.4%, is the lowest since the 2014-2018 period.
In EDUCATION: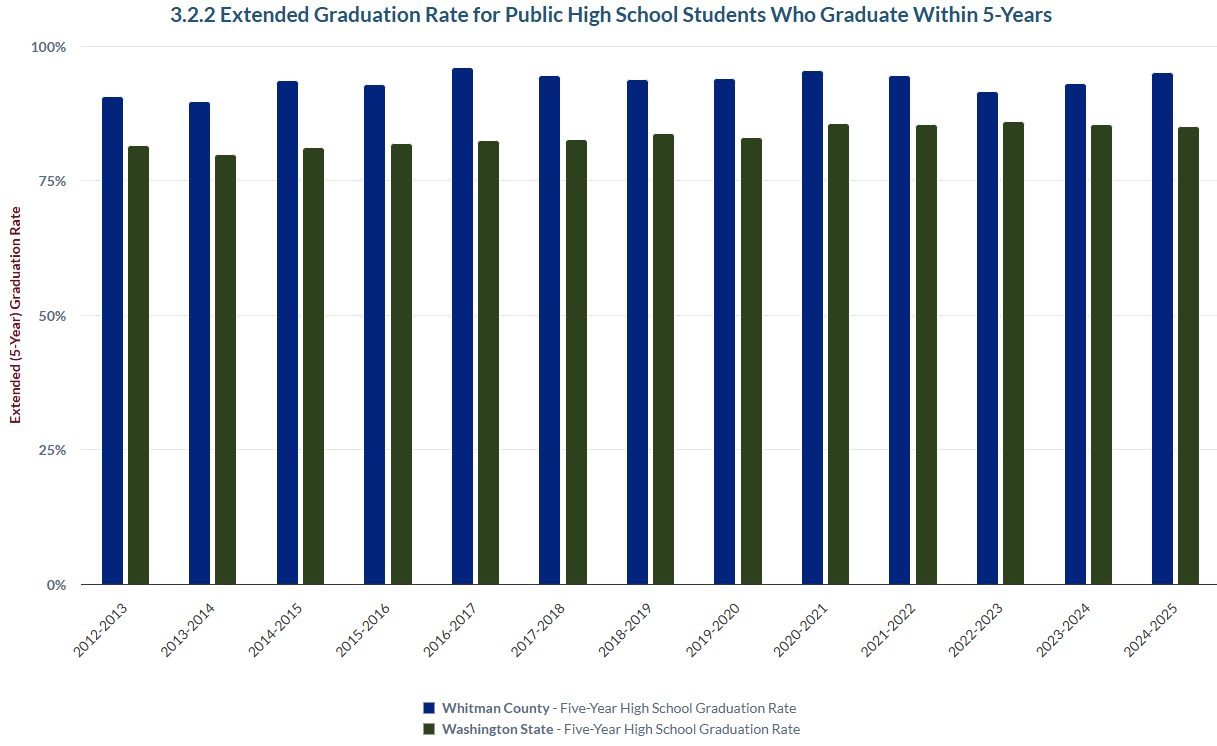
Extended graduation rates in Whitman County public schools remain very high.
The high school graduation rate is a key performance measure for school districts, and indirectly, the communities in which the districts operate. High school graduation is a significant milestone in a person’s development as well. Typically, the rate is measured over a four-year period. That is, it is defined as the share of a cohort who started 9th grade and received a diploma in 12th grade.
Yet, some students require a bit more time to fulfill all their graduation requirements. Consequently, a fifth year is offered by the Washington Office of Public Instruction that calculates the rate of a given cohort that started together in 9th grade and received a diploma within four or five years.
For the five-year cohort ending school in 2025, the average graduation rate county-wide was 95%. As the graph reveals, this is within the historical range for Whitman County school districts. It bested the average state 5-year rate by a full 10 percentage points. This gap over the state has also been typical for county public schools.
In HEALTH: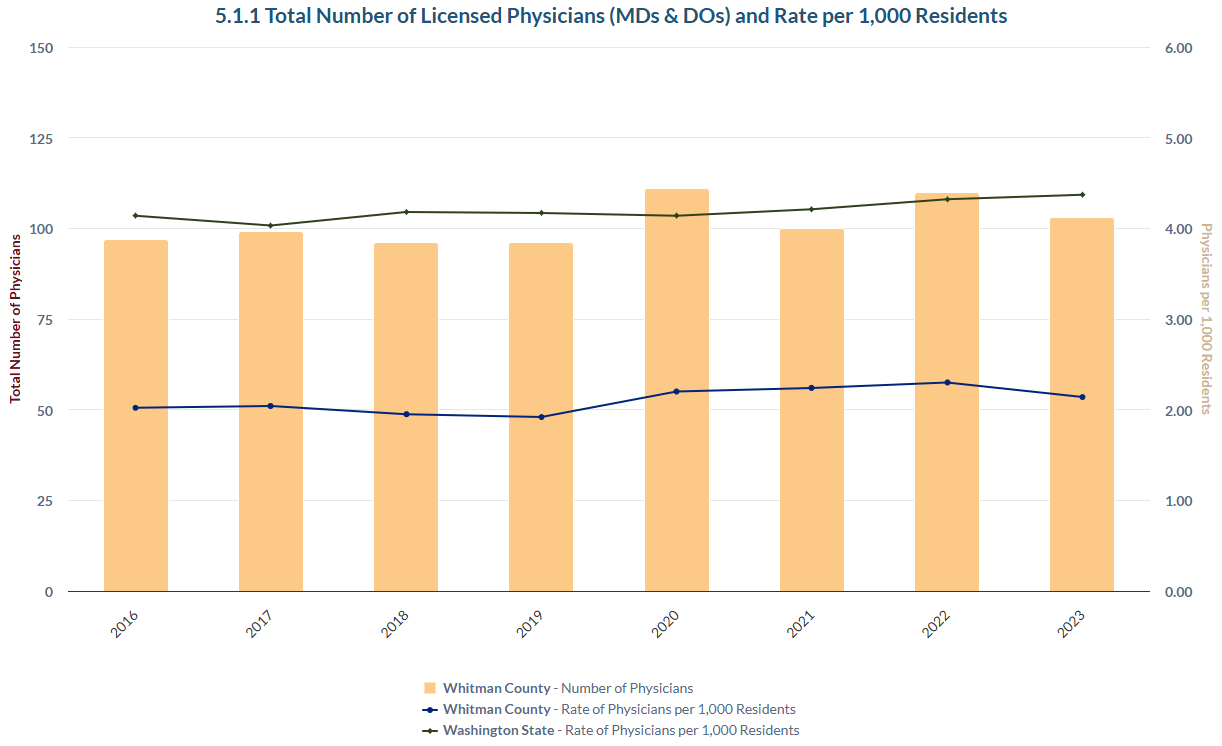
The number of licensed physicians in the county is stable, but low.
Good health can be attributed to a variety of factors – education, occupation, location – that are not clinical. But clinical factors matter, too. The availability of accessible health insurance is one factor. Another is access to care givers. This indicator measures one aspect of access to clinicians, physicians. One could also include nurses but an easily compiled report on licensed nurses by the counties of Washington state is not available.
According to licensure filings from the state of Washington, Whitman County could point to 103 physicians in 2023, the most recent year of data. That was slightly lower than the average of the prior three years. Expressed as a rate, there were 2.1 doctors, MDs or DOs, per 1,000 residents in the county in 2023, a bit lower than the average of the prior three years.
For the entire time span considered by this indicator, the “intensity” of physicians in the county has been a bit less than half of the state average.
In HOUSING: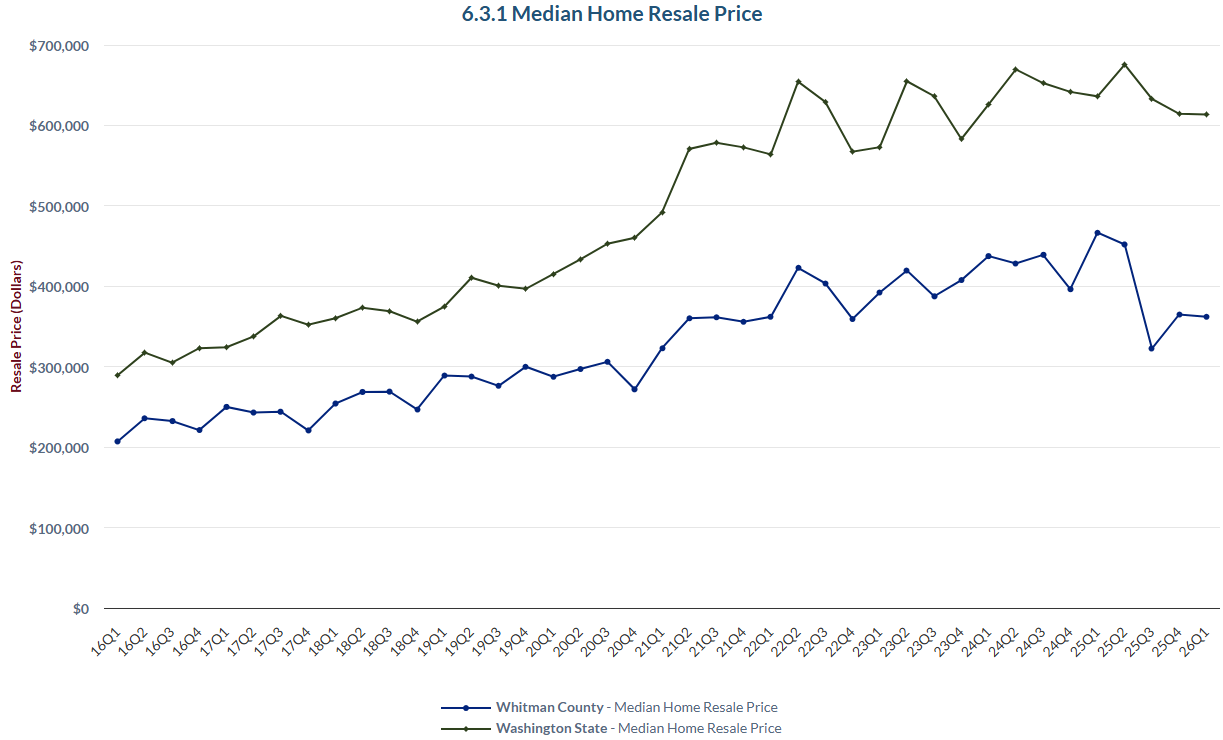
The median home resale price in the county started 2026 with a small decline.
A home purchase is typically the largest a household will make. Homes are purchased for the first time or as part of a “trade up” by a household or family. Whether either of these purchases happens depends on a variety of factors, on the supply and demand side. The price reflects the interplay between both sides.
This measure, from the Washington Center for Real Estate Research at the University of Washington, tracks homes that have been occupied at least once. In other words, new construction is excluded. Those already built, however, compose the bulk of total home inventory. The median is typically not the same as the average, and for markets that have a certain percentage of very pricey homes, it is a better measure of the “middle” of the distribution of prices.
In the first quarter of this year, the median resale price for Whitman County homes was $362,000. This is the second lowest price since Q4 of 2022. The overall median of the past three quarters has been less than $350,000 for the first time since the start of the pandemic. Will housing prices in the county find their way back to pre-pandemic levels?
updated 06.17.26
New Intern Features

Janay Bowen
Hometown: San Jose, CA
Major: Professional Accounting
Expected Graduation Date: Spring 2027
Post-graduations plans: Work at a local accounting firm to become a CPA!
After a few months of working on the Trends project, my favorite thing so far: My favorite thing so far working on Trends projects is when I get into the flow state of work and I am understanding and creating spreadsheets that I know help the counties we work for.